
MEXICO · COUNTRY GUIDE
Mexico Weather by Month and Region: When to Go
Mexico has no single climate. On the same January day it can be 28 °C on the beach at Cancún and 5 °C before dawn in San Cristóbal de las Casas, because altitude matters here as much as latitude.
Late November to April is the best window for most trips. We added up average rainfall across seven popular destinations for every month, and February came out driest at 100 mm combined. September was wettest at 1,438 mm, more than fourteen times as much. If your dates are fixed, the regional table below will tell you where the weather is on your side.

Best Time to Visit by Region
Based on the climate averages further down this page.
If the columns do not fit your screen, scroll sideways to see the full table.
| Destination | Best months | Avoid if you can | Why |
|---|---|---|---|
| Cancún and the Riviera Maya | February to April | September and October | The driest months bring 37 to 46 mm of rain. September and October each bring more than 220 mm. |
| Mérida and Chichén Itzá | November to February | April and May | Winter highs are 31 to 32 °C. May averages 36.7 °C, hard going at an unshaded archaeological site. |
| Mexico City | November to March | June to September | About 76% of the year's rain falls in those four summer months, usually as afternoon storms. |
| Oaxaca City | November to February | June to September | Almost no rain and highs of 29 to 31 °C. April is the hottest month, at 34.9 °C. |
| San Cristóbal de las Casas | November to April | May to September | Dry and clear, but nights can drop to 5 °C. Bring warm layers. |
| Puerto Vallarta | November to April | July to September | Winter is close to rainless. Each of those summer months brings over 300 mm. |
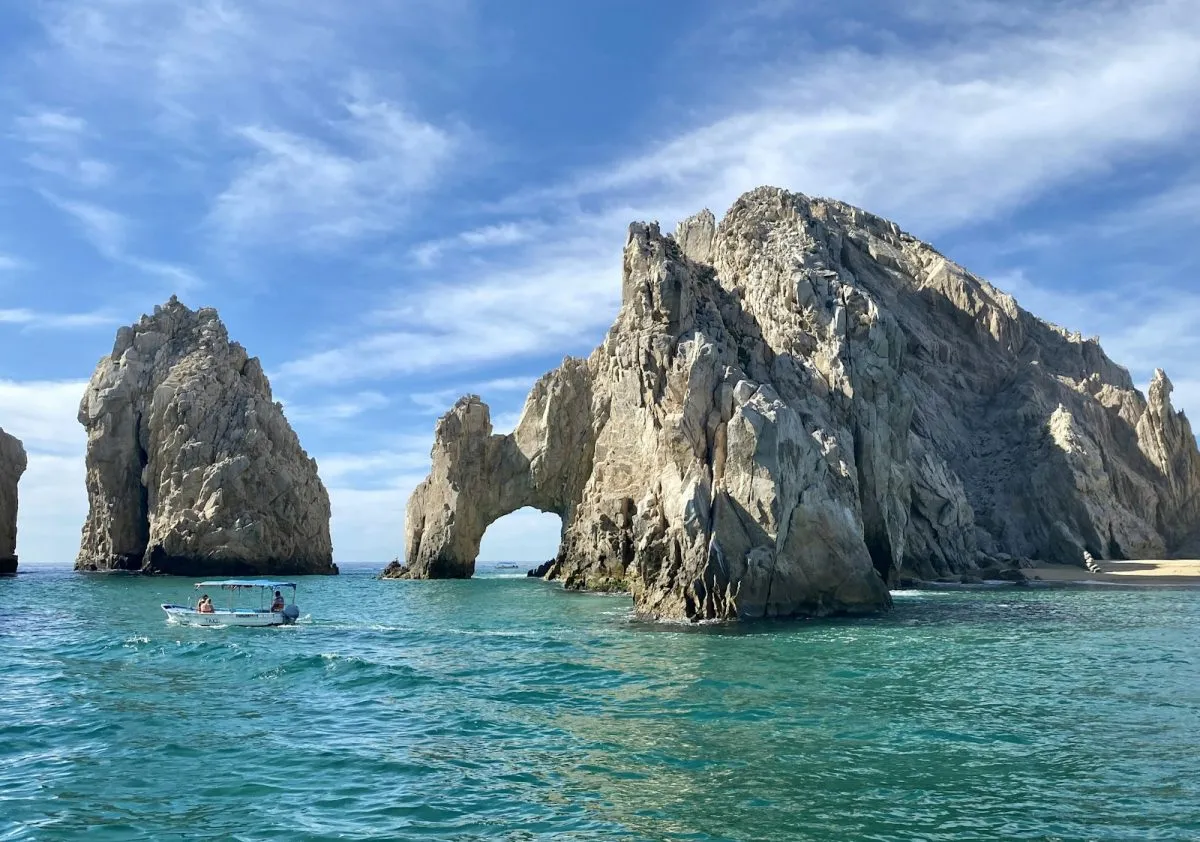
| Cabo San Lucas | November to June | August and September | From April to June there is almost no rain at all. Summer highs reach about 35 °C. |
Average High Temperature by Month
Mean daily maximum in °C.
If the columns do not fit your screen, scroll sideways to see the full table.
| City | Jan | Feb | Mar | Apr | May | Jun | Jul | Aug | Sep | Oct | Nov | Dec |
|---|---|---|---|---|---|---|---|---|---|---|---|---|
| Cancún | 28 | 29 | 31 | 32 | 33 | 34 | 34 | 34 | 33 | 32 | 30 | 29 |
| Mérida | 31 | 32 | 34 | 36 | 37 | 35 | 35 | 35 | 34 | 33 | 32 | 31 |
| Mexico City | 22 | 24 | 26 | 28 | 27 | 26 | 25 | 25 | 24 | 24 | 23 | 22 |
| Oaxaca City | 29 | 31 | 33 | 35 | 34 | 31 | 30 | 30 | 29 | 29 | 29 | 29 |
| San Cristóbal | 21 | 22 | 23 | 24 | 23 | 22 | 22 | 22 | 22 | 22 | 21 | 20 |
| Puerto Vallarta | 27 | 27 | 27 | 28 | 29 | 32 | 32 | 32 | 32 | 32 | 30 | 28 |
| Cabo San Lucas | 27 | 27 | 28 | 30 | 32 | 33 | 34 | 35 | 34 | 33 | 30 | 27 |
Average Low Temperature by Month
Mean daily minimum in °C. The highland cities are the ones where you need a jacket.
If the columns do not fit your screen, scroll sideways to see the full table.
| City | Jan | Feb | Mar | Apr | May | Jun | Jul | Aug | Sep | Oct | Nov | Dec |
|---|---|---|---|---|---|---|---|---|---|---|---|---|
| Cancún | 19 | 20 | 21 | 22 | 24 | 25 | 24 | 24 | 24 | 23 | 22 | 20 |
| Mérida | 17 | 18 | 19 | 21 | 22 | 23 | 23 | 23 | 23 | 21 | 19 | 18 |
| Mexico City | 8 | 10 | 11 | 13 | 14 | 14 | 13 | 13 | 13 | 12 | 10 | 8 |
| Oaxaca City | 10 | 12 | 14 | 16 | 17 | 17 | 16 | 16 | 16 | 14 | 12 | 11 |
| San Cristóbal | 5 | 5 | 7 | 8 | 10 | 12 | 11 | 11 | 12 | 10 | 8 | 6 |
| Puerto Vallarta | 17 | 17 | 17 | 19 | 22 | 25 | 25 | 24 | 24 | 24 | 21 | 18 |
| Cabo San Lucas | 13 | 13 | 14 | 15 | 16 | 18 | 22 | 24 | 23 | 21 | 18 | 14 |
Average Rainfall by Month
Average precipitation in millimetres. The last row is the sum of the rounded destination values shown.
If the columns do not fit your screen, scroll sideways to see the full table.
| City | Jan | Feb | Mar | Apr | May | Jun | Jul | Aug | Sep | Oct | Nov | Dec |
|---|---|---|---|---|---|---|---|---|---|---|---|---|
| Cancún | 56 | 43 | 45 | 37 | 84 | 146 | 111 | 115 | 223 | 242 | 112 | 80 |
| Mérida | 34 | 27 | 26 | 25 | 67 | 152 | 143 | 152 | 184 | 99 | 42 | 44 |
| Mexico City | 12 | 6 | 12 | 24 | 59 | 132 | 174 | 176 | 158 | 71 | 17 | 5 |
| Oaxaca City | 2 | 5 | 18 | 47 | 98 | 188 | 119 | 132 | 164 | 63 | 9 | 9 |
| San Cristóbal | 10 | 9 | 16 | 37 | 141 | 235 | 141 | 180 | 229 | 106 | 32 | 9 |
| Puerto Vallarta | 34 | 5 | 2 | 2 | 15 | 188 | 328 | 312 | 370 | 94 | 20 | 22 |
| Cabo San Lucas | 6 | 5 | 1 | 0 | 0 | 0 | 8 | 85 | 110 | 25 | 17 | 7 |
| All seven | 154 | 100 | 120 | 172 | 464 | 1041 | 1024 | 1152 | 1438 | 700 | 249 | 176 |
Two patterns stand out. First, the Caribbean's wettest months come late, in September and October, while central Mexico's rain arrives earlier and ends sooner. Second, Cabo San Lucas does not follow the rest of the country at all: it is dry for most of the year, and much of its small annual total falls in August and September. Our map of Mexico shows where each destination lies.
Why the Climate Changes So Much
Three things shape the weather. The Tropic of Cancer crosses the country, so the south is tropical and the far north is desert or semi-desert. The Sierra Madre ranges and the volcanic belt across the middle lift large areas well above 1,500 metres, where days are mild and nights cool even in the tropics. And two very different seas sit on either side, feeding moisture and storms from the Caribbean and the Pacific.
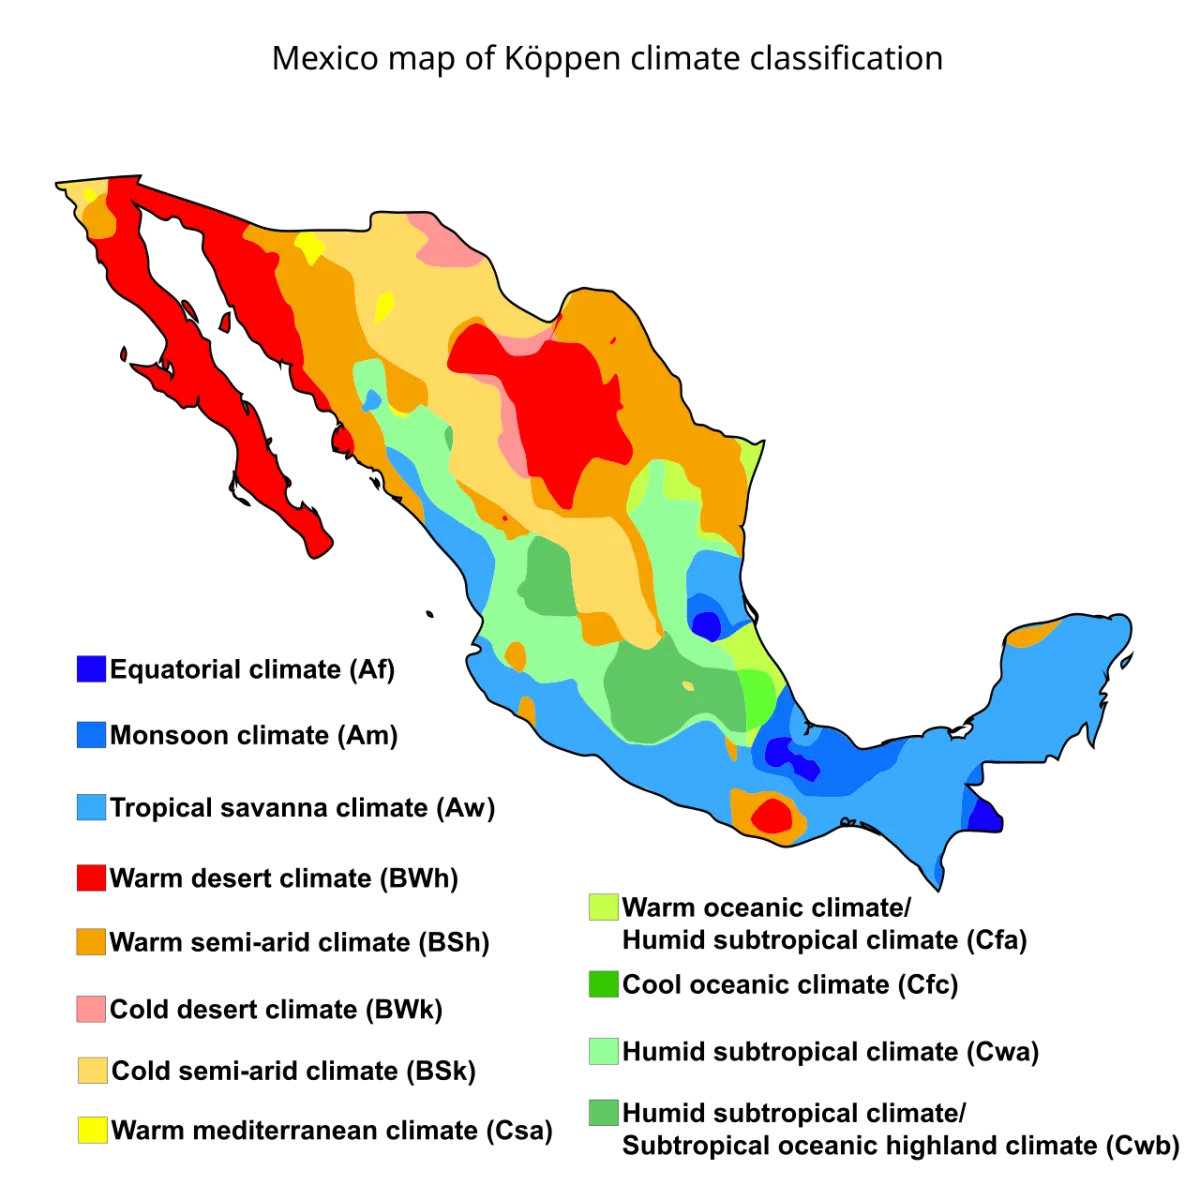

For travellers, altitude is the practical point. Mexico City's average high never goes above 28 °C, even in spring, while the coast at the same latitude is far hotter and more humid. Packing for one tells you very little about the other.
Hurricane Season
The official Atlantic hurricane season runs from 1 June to 30 November. The eastern Pacific season starts earlier, on 15 May, and also ends on 30 November. Most weeks in these months are perfectly usable, and a single storm affects only part of a coast, but flexible bookings and travel insurance are sensible from August to October. Follow the US National Hurricane Center and local civil protection notices if a storm is forecast.
What to Pack
If the columns do not fit your screen, scroll sideways to see the full table.
| Going to | Bring |
|---|---|
| Caribbean and Pacific coasts | Light clothes, reef-safe sun protection, insect repellent, a rain layer from June to October |
| Mexico City and Oaxaca | Layers, a light jacket for evenings, an umbrella in the summer months |
| San Cristóbal and other highlands | A warm fleece or coat for the evening, especially from November to February |
| Yucatán ruins | Hat, water bottle, and an early start. Shade is limited at most sites |
| Baja desert | Sun cover and a warm layer for winter evenings, when lows fall to about 13 °C |
Mexico Weather FAQ
What is the climate in Mexico?
It ranges from desert in the north to tropical in the south, with cool highlands across the centre. Rain falls mostly from June to October, and winter is dry across most of the country.
What is the average temperature in Mexico?
There is no meaningful national figure. Average highs run from about 22 °C in Mexico City in January to about 37 °C in Mérida in May. Lows can be 5 °C in the Chiapas highlands.
What is the rainy season in Mexico?
Roughly June to October. Baja California is the main exception, with little rain for most of the year and a short late-summer peak.
Does it get cold in Mexico?
Yes, in the highlands. Mexico City's January average low is 8.5 °C, and San Cristóbal's is about 5 °C. The Caribbean coast rarely falls below 19 °C on average.
When is hurricane season in Mexico?
1 June to 30 November on the Atlantic and Caribbean side, and 15 May to 30 November in the eastern Pacific.
Climate Data Sources
Facts were checked on 8 November 2026. Monthly figures come from the climate tables on Wikipedia's city pages, which draw on Mexico's Servicio Meteorológico Nacional normals (mostly 1991 to 2020). Puerto Vallarta's table cites the World Meteorological Organization and Weatherbase and gives no period, so treat it as a rougher guide. Cancún's table states 1991 to 2020 in its title but cites 1951 to 2010 in its source note. The combined rainfall comparison is our own calculation; its totals were recalculated from the rounded values shown on 9 November 2026. Hurricane dates are from the US National Hurricane Center. These are long-term averages, not forecasts.