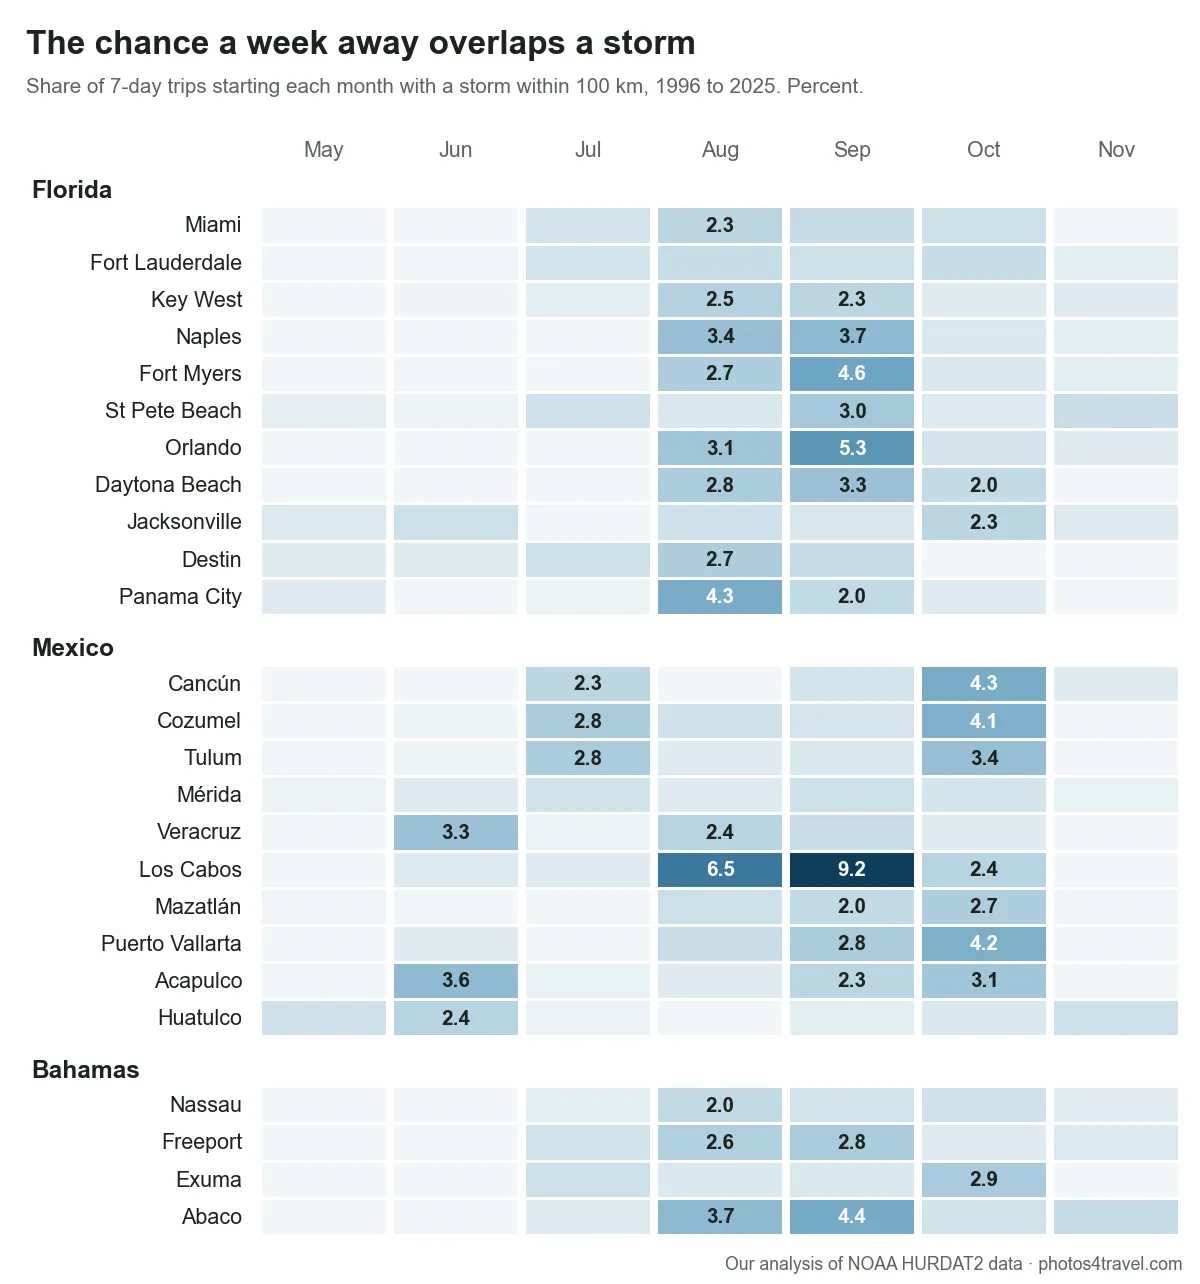
There is no single worst month for hurricanes. In Florida and the Bahamas it is September. On Mexico's Caribbean coast and around Puerto Vallarta it is October. Los Cabos is the outlier: a week there in September has about a 1 in 11 chance of a storm passing close by. At the other 24 places we checked, the odds stayed under 6% even in their worst month.
"Hurricane season" is a poor way to plan a holiday. It covers six months and thousands of kilometres of coast, and it treats a June week in Miami the same as an October week in Cozumel. So we went to the raw storm tracks. We took 30 years of records from the US National Hurricane Center, 1996 to 2025, marked 25 resort areas on them, and counted every storm whose centre came within 100 km.
Then we asked the question a traveller would ask: if I book seven days starting at a random date in this month, how often has a storm been nearby during that week? That number is the backbone of this article. It is small almost everywhere. It is also very different from one coast to the next.
The month-by-month table
Each figure is the share of 7-day trips, starting in that month, that overlapped a tropical storm or hurricane within 100 km of the places listed. Where a region covers several places, we averaged them. Each region's highest month is in bold.
| Region | May | Jun | Jul | Aug | Sep | Oct | Nov |
|---|---|---|---|---|---|---|---|
| South Florida (Miami, Fort Lauderdale, Key West) | 0.0% | 0.0% | 1.1% | 2.2% | 1.9% | 1.4% | 0.5% |
| Southwest Florida (Naples, Fort Myers, St Pete Beach) | 0.2% | 0.1% | 0.5% | 2.4% | 3.8% | 1.0% | 1.0% |
| Orlando | 0.0% | 0.0% | 0.0% | 3.1% | 5.3% | 1.3% | 0.8% |
| Northeast Florida (Daytona, Jacksonville) | 0.5% | 0.8% | 0.0% | 2.1% | 2.2% | 2.1% | 0.4% |
| Florida Panhandle (Destin, Panama City) | 0.8% | 0.4% | 0.9% | 3.5% | 1.9% | 0.4% | 0.0% |
| Riviera Maya (Cancún, Cozumel, Tulum) | 0.0% | 0.1% | 2.6% | 0.8% | 1.2% | 3.9% | 0.3% |
| Mexico Gulf side (Mérida, Veracruz) | 0.1% | 2.0% | 0.8% | 1.6% | 1.6% | 1.1% | 0.2% |
| Los Cabos | 0.0% | 0.9% | 0.8% | 6.5% | 9.2% | 2.4% | 0.0% |
| Mexico central Pacific (Mazatlán, Puerto Vallarta) | 0.0% | 0.4% | 0.0% | 1.6% | 2.4% | 3.5% | 0.0% |
| Mexico south Pacific (Acapulco, Huatulco) | 0.8% | 3.0% | 0.3% | 0.4% | 1.4% | 2.0% | 0.8% |
| Northern Bahamas (Freeport, Abaco) | 0.0% | 0.0% | 1.1% | 3.2% | 3.6% | 1.1% | 1.4% |
| Central Bahamas (Nassau, Exuma) | 0.0% | 0.0% | 1.1% | 1.5% | 1.1% | 2.2% | 0.3% |
From December to April, none of the 25 places had a single tropical storm or hurricane pass within 100 km in 30 years. Three quarters of all the passes we counted (206 of 273) came in August, September and October.
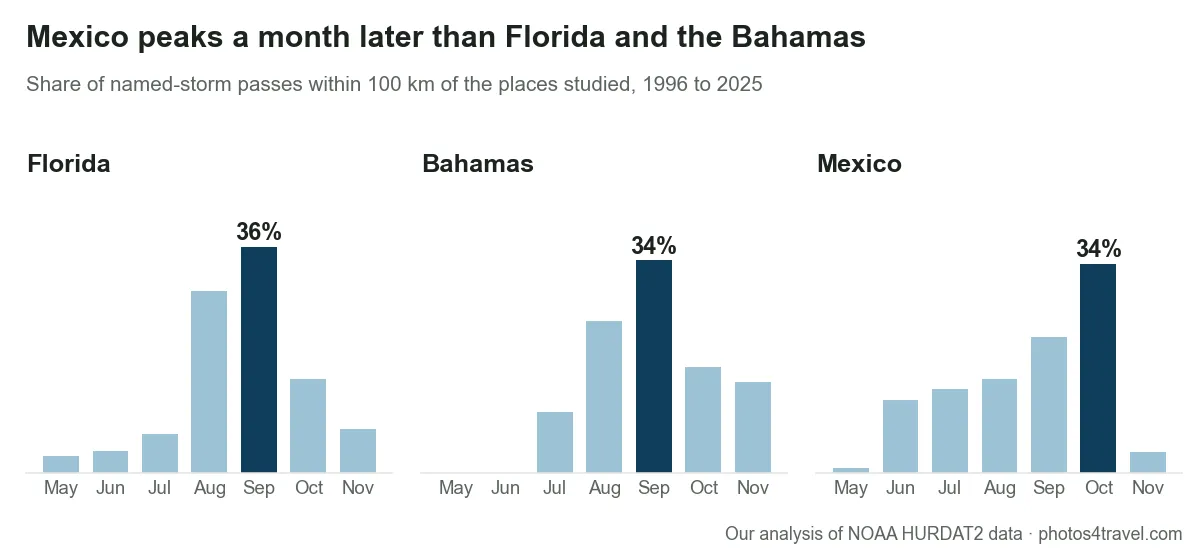
The second pattern is timing. Florida and the Bahamas follow the textbook, with a peak around the 10 September date the National Hurricane Center gives for the Atlantic as a whole. Mexico doesn't. A third of its storm passes came in October, and that month produced 24 of its 55 hurricane passes.
All 25 places, ranked
Ranked by the odds in each place's own worst month. "Named storms" includes hurricanes. A "year with a hurricane" shows how scattered the risk is: five hurricanes across two seasons is a different thing from five across five.
| Place | Region | Named storms | Hurricanes | Years with a hurricane | Worst month | Chance for a week that month |
|---|---|---|---|---|---|---|
| Los Cabos | Mexico | 24 | 11 | 11 | September | 9.2% |
| Orlando | Florida | 13 | 5 | 4 | September | 5.3% |
| Fort Myers Beach | Florida | 11 | 4 | 4 | September | 4.6% |
| Abaco | Bahamas | 15 | 9 | 7 | September | 4.4% |
| Cancún | Mexico | 11 | 5 | 5 | October | 4.3% |
| Panama City Beach | Florida | 10 | 2 | 2 | August | 4.3% |
| Puerto Vallarta | Mexico | 12 | 6 | 6 | October | 4.2% |
| Cozumel | Mexico | 13 | 8 | 5 | October | 4.1% |
| Naples | Florida | 11 | 5 | 4 | September | 3.7% |
| Acapulco | Mexico | 13 | 7 | 7 | June | 3.6% |
| Tulum | Mexico | 11 | 7 | 4 | October | 3.4% |
| Daytona Beach | Florida | 10 | 4 | 4 | September | 3.3% |
| Veracruz | Mexico | 10 | 1 | 1 | June | 3.3% |
| St Pete Beach (Tampa Bay) | Florida | 11 | 4 | 3 | September | 3.0% |
| Exuma | Bahamas | 8 | 6 | 6 | October | 2.9% |
| Freeport | Bahamas | 10 | 5 | 4 | September | 2.8% |
| Destin | Florida | 10 | 3 | 3 | August | 2.7% |
| Mazatlán | Mexico | 8 | 4 | 4 | October | 2.7% |
| Key West | Florida | 9 | 5 | 4 | August | 2.5% |
| Huatulco | Mexico | 9 | 4 | 3 | June | 2.4% |
| Jacksonville Beach | Florida | 10 | 2 | 2 | October | 2.3% |
| Miami | Florida | 9 | 3 | 2 | August | 2.3% |
| Nassau | Bahamas | 8 | 5 | 5 | August | 2.0% |
| Fort Lauderdale | Florida | 9 | 3 | 2 | August | 1.8% |
| Mérida | Mexico | 8 | 2 | 2 | September | 1.6% |
With only 30 years of data, these are small counts. One storm more or less moves a figure noticeably, so treat a gap of a point or so between two places as a tie.
Florida: the middle of the state is not a shelter
The result we didn't expect was Orlando. It sits about 80 km from the nearest coast, yet it had 13 named storms and 5 hurricane passes in our period, against 9 and 3 for Miami. Storms that come ashore on either coast tend to cross the peninsula, and Orlando is in the way: Charley and Jeanne in 2004, Irma in 2017, Ian in 2022 and Milton in 2024. Winds usually drop once a storm is over land, so a pass there is often less violent than on the beach. Theme parks and flights still get disrupted, and September at 5.3% is the highest figure in the state.
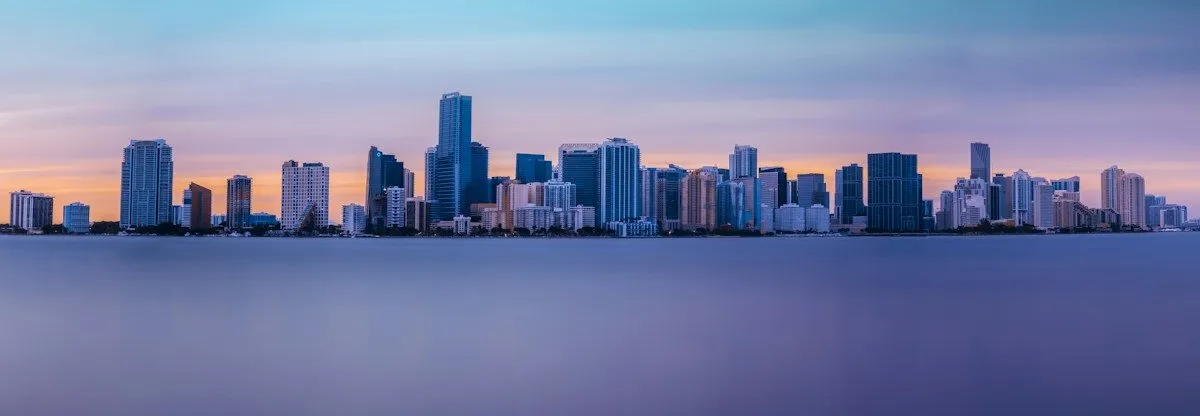
Miami's numbers look calm, and they need a warning label. All three of its hurricane passes came in just two seasons (Irene in 1999, Katrina and Wilma in 2005). Irma doesn't count in our 100 km table because its centre tracked up the west coast, but it still battered South Florida. Widen the circle to 200 km and Miami goes from 3 hurricanes to 8. Our Miami guide covers the city itself.
The southwest coast is where September really bites. Fort Myers Beach reached 4.6%, and its four hurricane passes include Charley, Wilma, Irma and Ian, a list that would make anyone check their cancellation terms.
The Panhandle runs on a different clock. Panama City Beach peaks in August at 4.3% and Destin's busiest months start early, with named storms in May, June and July in our record. Most of those were weaker systems, and October looks quiet on paper. Don't take that too far: Hurricane Michael struck this coast in October 2018.
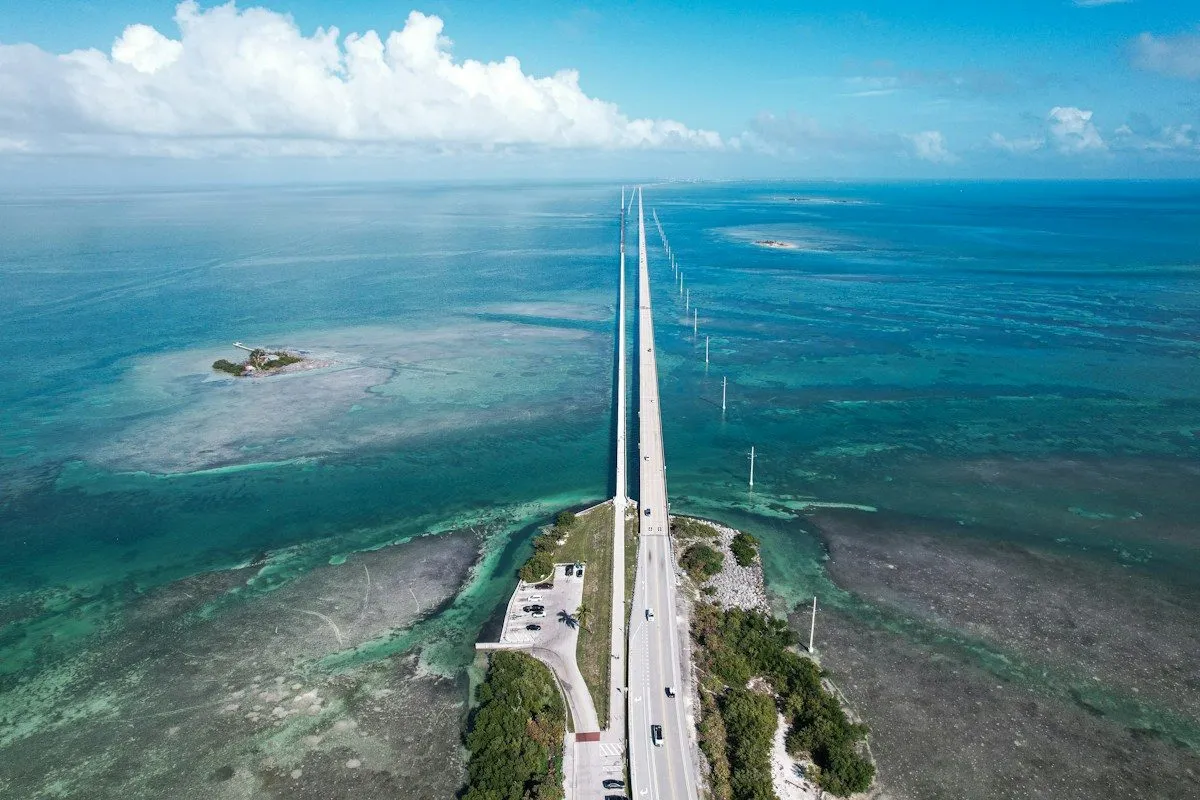
The Keys deserve their own rule. Key West had 5 hurricane passes in 4 seasons, and there is one road out. When Irma approached, Monroe County ordered all visitors to leave on the morning of 6 September 2017, hours before the order for residents. If you are on holiday there, expect to be among the first people told to go. For the rest of the state, start with our Florida guide and what to do beyond the theme parks.
Mexico has two seasons, on two coasts
Mexico sits between two hurricane basins. The Caribbean side belongs to the Atlantic season, which runs from 1 June to 30 November. The Pacific side starts about two weeks earlier, on 15 May. Booking a "Mexico beach holiday" in autumn tells you very little until you pick a coast.
Cancún, Cozumel and Tulum
October is the month to respect here. More than half of the named storms near Cancún and Tulum came in October, 6 of 11 at each. Cozumel had three hurricane passes in a single 23-day stretch in October 2020: Gamma, Delta and Zeta. July is a smaller second peak, with Emily in 2005 and Beryl in 2024.
August and September look surprisingly low in the table, at 0.8% and 1.2%. We wouldn't lean on that too hard. Grace crossed this coast in August 2021, and with so few storms in the record, a quiet month may just be a lucky one. Our honest reading is that the risk runs from July to November, with October clearly worse.

Los Cabos
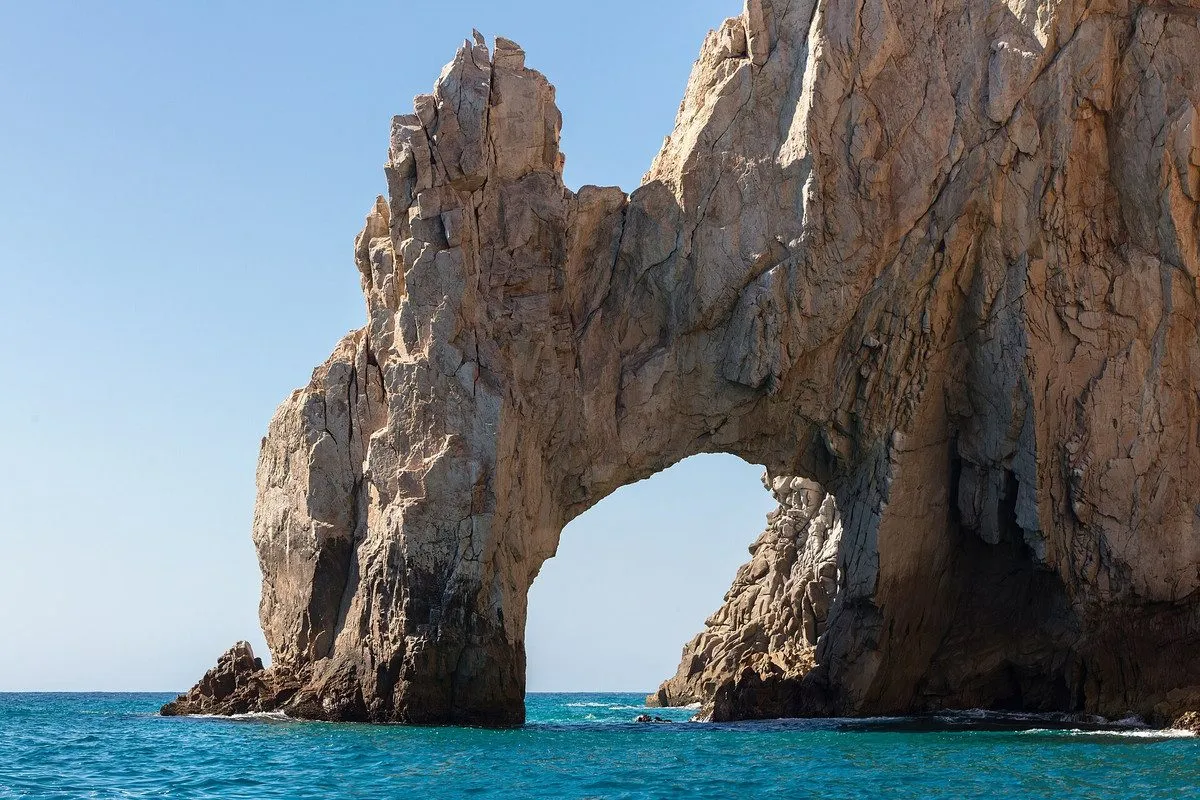
This is the clearest result in the whole study. Los Cabos had 24 named storms and 11 hurricane passes, each hurricane in a different year, and 9 of those 11 were in September. Odile in September 2014 is the one people remember. A September week came out at 9.2% and an August week at 6.5%, higher than any other place and month we measured.
There is an easy fix. November had no passes at all in 30 years. October is much better than September at 2.4%, although Norma arrived in October 2023. If you want Baja in autumn, push the trip back by six weeks.
Puerto Vallarta, Mazatlán and Acapulco
Puerto Vallarta is another October story: 5 of its 6 hurricane passes, including Patricia in 2015 and Lidia in 2023. Mazatlán is similar but quieter, with 8 named storms in total.
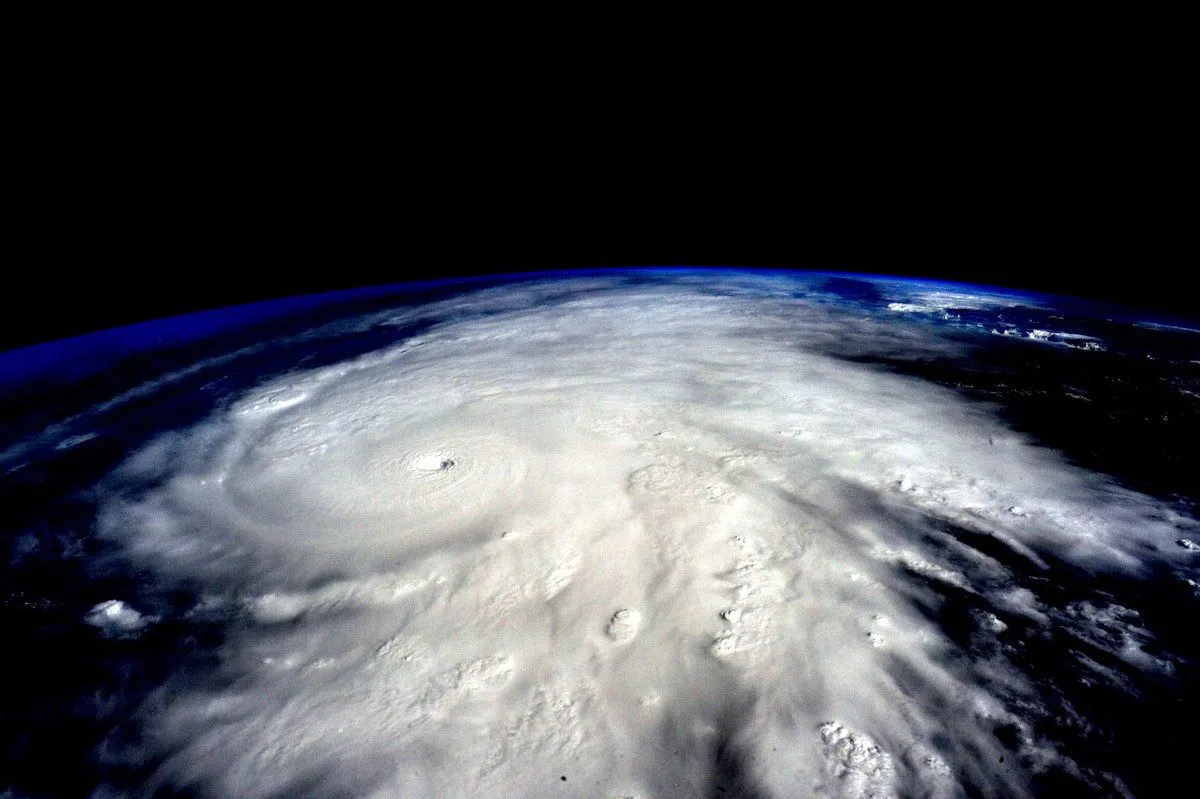
Further south, Acapulco has two danger periods. June came out at 3.6%, with Boris in 1996, Carlos in 2015 and Erick in 2025 all passing at hurricane strength. October came out at 3.1%, and it produced the storm that changed how people think about this coast. NOAA's own record shows Otis as a 102 km/h tropical storm on 24 October 2023. Twenty-one hours later it was at 269 km/h, and within hours it came ashore near Acapulco. A forecast several days ahead would not have prepared anyone for that, which is the best argument we can offer for flexible bookings on this stretch of coast. Our Mexico weather page has the wider climate picture and health and safety covers the practical side.
The Bahamas: north and centre behave differently
The islands look like one destination on a booking site, but the storm record splits them. Abaco, in the north, had 15 named storms and 9 hurricane passes. Nassau had 8 and 5. Abaco's September figure of 4.4% is the highest in the country, and it is the island Dorian devastated in 2019.
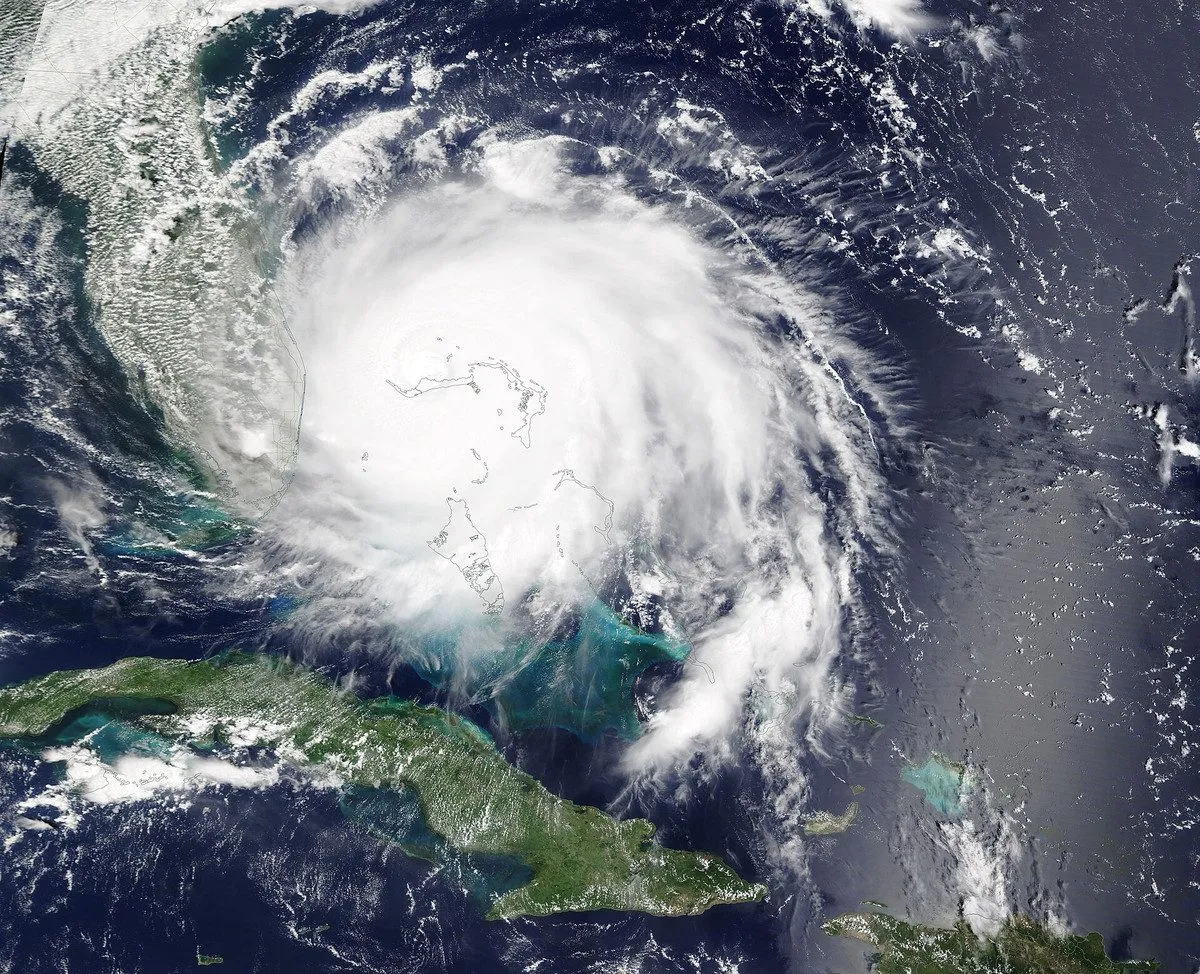
Move south to Exuma and the peak shifts to October, with 4 of its 6 hurricane passes in that month: Lili in 1996, Sandy in 2012, Matthew in 2016 and Melissa in 2025.
The Bahamas is also the place where November is least safe to ignore. Close to 15% of its passes came in that month, a bigger share than in Florida or Mexico, and Abaco's November figure of 1.9% is higher than its July. Michelle in 2001, Noel in 2007 and Nicole in 2022 all came through in November. See our Bahamas weather guide for the month-by-month climate.
When to book
Our reading of the storm record from May to November, region by region. "Lowest storm odds" means the months with the fewest close passes in those 30 years.
| Region | Lowest storm odds | Be careful | Our advice |
|---|---|---|---|
| South Florida | May, June, November | August to October | Fine with flexible rates. Book the Keys more cautiously. |
| Southwest Florida | May to July | August, September | Avoid non-refundable September stays. |
| Orlando | May to July | September | Go in June or early July if school dates allow. |
| Florida Panhandle | October, November | August | Late season is the better bet, with Michael as the caution. |
| Riviera Maya | May, June, November | October, then July | Skip October if you can only make one choice. |
| Los Cabos | May, November | August, September | The one place where we'd move the trip. |
| Puerto Vallarta, Mazatlán | May, July, November | October | July beats October on storms. |
| Acapulco, Huatulco | July, August | June, October | Keep bookings changeable in both peaks. |
| Northern Bahamas | May, June | August to November | The season runs longer than most people plan for. |
| Central Bahamas | May, June | October | Nassau and Exuma are safer choices than Abaco in autumn. |
Storms are only one part of the choice. June and July are hot across all of these regions and humid on most of the coasts, and low storm odds won't change that.
What the odds leave out
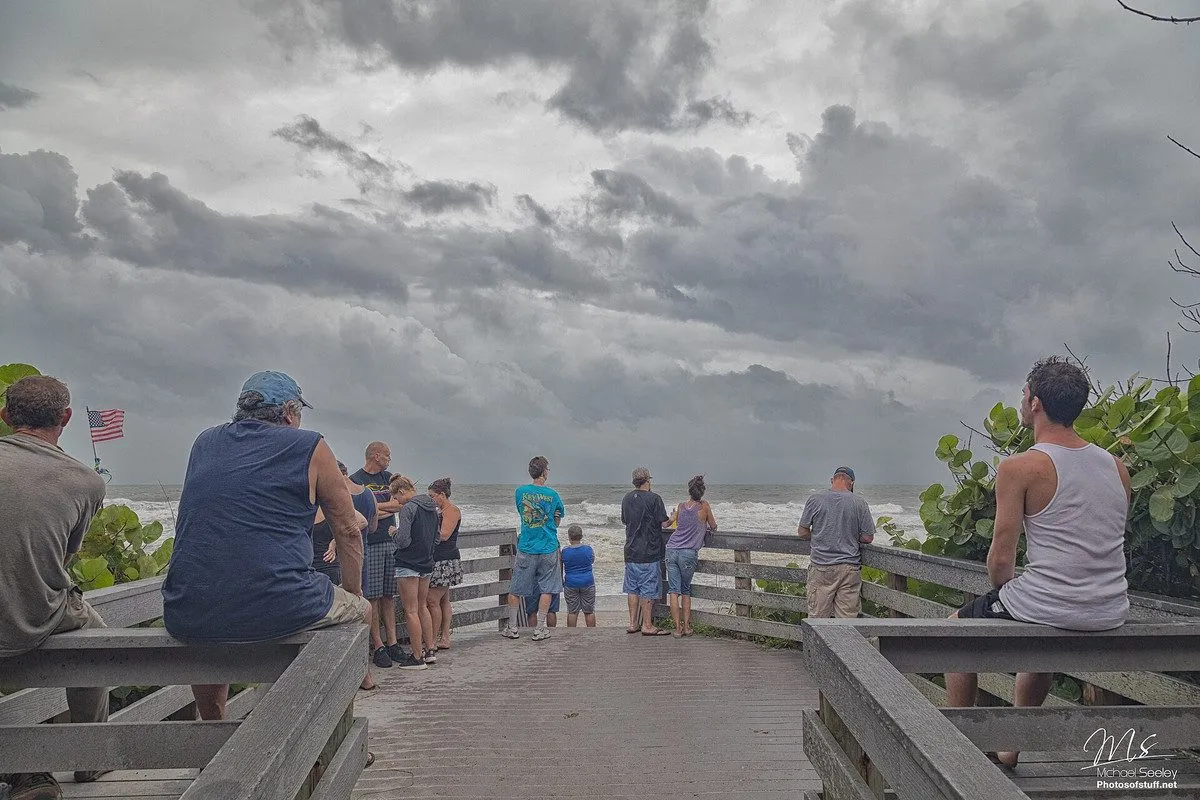
A 5% chance sounds easy to live with, and for one trip it mostly is. Three things can still catch you out.
- A near miss can still wreck a holiday. A storm 200 km away can bring days of rain, closed beaches and rough seas. With a 200 km circle our counts jump: Miami goes from 9 named storms to 17, and Orlando from 13 to 21.
- Your flight depends on other places. A storm over your connecting airport can cancel a trip to somewhere with blue skies.
- An average says nothing about your year. Cozumel in October 2020 and South Florida in 2005 show how storms cluster. Quiet decades and awful seasons sit in the same 30-year record.
How to protect a booking
- Buy insurance when you book, not when the news gets worrying. Once a storm has a name, it counts as a foreseeable event. NerdWallet's guide says you typically need a policy at least 24 hours before naming for the full benefits to apply.
- Read the "cancel for any reason" terms. It is an optional extra that usually pays back only part of your prepaid costs, and it often has to be added soon after your first deposit.
- Pay for a flexible room rate from August to October. This costs more, but it is the simplest protection you can buy. Check the cancellation deadline, because a 7-day cut-off is no use for a storm you can only see 5 days out.
- Look for a hurricane guarantee. Some destinations and hotels offer one. The Cayman Islands programme for 2026 covers 1 June to 30 November, with terms that vary by property, and is worth a look if you are weighing up the Cayman Islands against somewhere else.
- Know the warning terms. The National Hurricane Center issues a hurricane watch 48 hours and a warning 36 hours before tropical-storm-force winds are expected. A watch for your area is the moment to contact your airline and hotel.
- Follow evacuation orders straight away. As a visitor you have no property to protect and fewer local options than anyone else.
FAQ
What is the worst month for hurricanes in Florida?
September, for most of the state. In our 30-year record, 41 of Florida's 113 storm passes came in September and 33 in August. The Panhandle is the exception, with August ahead.
Is it safe to go to Cancún in October?
Most October weeks pass without a storm. In our data, about 4% of 7-day trips to Cancún overlapped one, the highest of any month there. Go with a flexible booking and insurance, and leave at once if you are told to.
When is the best time to avoid hurricanes in Los Cabos?
Any time from November to May. We found no storms within 100 km in those months, and only one each in June and July. August and September are the months to avoid.
Is Orlando safe from hurricanes?
It is safer from storm surge, because it is inland, but it is not outside the storm track. Orlando had more named storms within 100 km than Miami in our record. Winds are usually weaker there than at the coast.
Do hurricanes hit the Bahamas in November?
Yes, more often than most people assume. About 15% of the storm passes we counted in the Bahamas came in November, and Abaco, Nassau and Freeport all had hurricane passes in that month.
Is hurricane season a bad time to travel?
Not on these numbers. Even in the worst month, the typical chance of a storm passing near a given week was under 5%. The bigger risk is a non-refundable booking in the one month that is worst for your particular coast.
Sources and checks
Last checked 9 November 2026. The rankings and odds here are our own analysis of the HURDAT2 best-track databases for the Atlantic and the eastern and central Pacific, published by NOAA's National Hurricane Center (versions covering storms through 2025). Season dates and the Atlantic peak come from the National Hurricane Center's climatology page.
- We counted a storm when its centre came within 100 km of a set point at tropical-storm strength (at least 63 km/h, or 39 mph) or more. A "hurricane pass" means it was at hurricane strength (at least 119 km/h, or 74 mph) at that distance. We interpolated between the 6-hourly track positions.
- A pass is not the same as hurricane winds at your hotel. Storm size varies widely. Some passes brought little more than rain, and some storms outside the circle did serious damage.
- The weekly figure is the share of all 7-day trips starting in a given month from 1996 to 2025 that had at least one day with a storm within 100 km. Dates are in UTC.
- A storm passing several places is counted once for each place, so the 273 total counts passes, not separate storms.
- These are small numbers. A low figure for one month may be luck, and 30 years is not long enough to prove that a month is safe.
- The 2026 season is not included, because NOAA had not added it to the database when we checked.
- The past is a guide, not a forecast. For a live storm, use the National Hurricane Center and local civil protection notices.