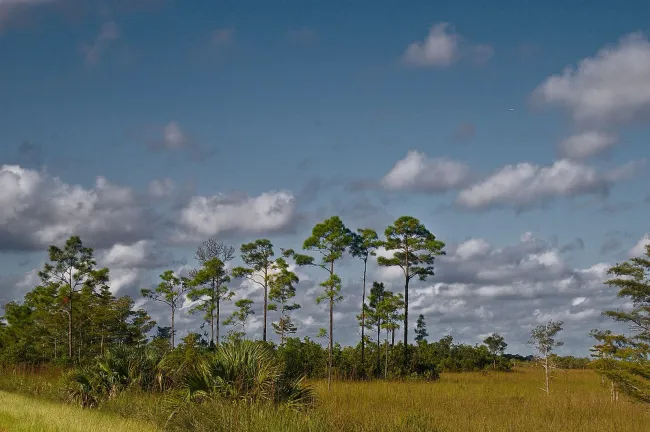
The comparisons below use six local NOAA weather stations. They show how much changes between northern Florida, the central peninsula, Miami and Key West. For routes crossing several regions, use the whole comparison rather than packing for the weather at your arrival airport.
Choose a season for the trip you want
Beach time, theme parks or wildlife?
Walking around a historic town, spending six hours in a theme park and sitting on a boat expose you to different conditions. A comfortable temperature for sightseeing does not establish comfortable swimming water. Equally, a month with considerable rainfall can still offer usable outdoor periods, but fixed boat departures and weather-sensitive attractions need room to change.
Swipe or scroll horizontally to compare all columns.
| Trip priority | Useful period to compare | Why consider it? | Main trade-off |
|---|---|---|---|
| Cities, gardens and outdoor sightseeing | March–April; November | A starting point between the coolest northern months and the hottest summer period | Holiday dates, actual forecast and local events still matter |
| Everglades walking and wildlife observation | Usually December–April | The park identifies this as its typical dry season | It is also the busiest season; wildlife sightings remain unpredictable |
| South Florida winter escape | December–February | Miami and Key West have much warmer winter nights than northern stations | A sunny afternoon does not guarantee warm water or calm seas |
| Panhandle beach holiday | Compare late spring with summer | Northern coastal air is warmer than in midwinter | Summer heat, rain, surf conditions and tropical weather require flexibility |
| School-holiday theme park trip | Your available dates, with a realistic pace | A workable schedule is more useful than chasing an unavailable ideal month | Heat, holidays, ticket conditions and operating calendars shape the day |
A short trip or a route across the state?
A four-night Orlando visit needs one local forecast. A fortnight including St Augustine, Miami and the Keys needs separate checks for each stay. Avoid adding the Panhandle merely because its weather looks attractive on the same monthly chart: distance remains a constraint. The Florida itineraries separate routes by usable travel time, while Where to Stay helps choose overnight bases.
Florida weather by month, using local climate stations
These are NOAA/NCEI 1991–2020 monthly climate normals, retrieved on 11 November 2026. “High / low” means the month's average daily maximum and minimum, not its record extremes or a forecast range. Temperatures are converted from the source's Fahrenheit values to Celsius; Celsius is rounded to one decimal. Rainfall is converted from inches to millimetres and rounded to the nearest millimetre.
How northern and southern Florida differ
January's normal overnight low is about 6–7°C in Pensacola and Jacksonville, compared with about 18.6°C in Key West. The difference matters to evening meals outdoors, an early start and the clothes you need. By July, all six stations have hot normal daytime highs, so travelling north within Florida does not remove the need to plan around summer heat.
Swipe or scroll horizontally to compare all columns.
| Month | Pensacola | Jacksonville | Orlando | Tampa | Miami | Key West |
|---|---|---|---|---|---|---|
| Jan | 17.1 / 6.5°C (62.7 / 43.7°F) | 18.6 / 6.1°C (65.5 / 42.9°F) | 22.1 / 9.7°C (71.8 / 49.5°F) | 21.8 / 11.6°C (71.3 / 52.8°F) | 24.6 / 16.1°C (76.2 / 61.0°F) | 24.3 / 18.6°C (75.8 / 65.5°F) |
| Feb | 19.1 / 8.4°C (66.4 / 47.2°F) | 20.5 / 7.8°C (68.9 / 46.1°F) | 23.8 / 11.3°C (74.9 / 52.4°F) | 23.3 / 13.1°C (74.0 / 55.5°F) | 25.7 / 17.3°C (78.2 / 63.2°F) | 25.2 / 19.5°C (77.4 / 67.1°F) |
| Mar | 22.2 / 11.5°C (72.0 / 52.7°F) | 23.5 / 10.3°C (74.3 / 50.6°F) | 26.1 / 13.2°C (78.9 / 55.8°F) | 25.4 / 15.2°C (77.8 / 59.3°F) | 27.0 / 18.7°C (80.6 / 65.6°F) | 26.4 / 20.7°C (79.6 / 69.3°F) |
| Apr | 25.3 / 15.0°C (77.6 / 59.0°F) | 26.6 / 13.6°C (79.8 / 56.4°F) | 28.7 / 15.9°C (83.6 / 60.7°F) | 28.3 / 18.2°C (83.0 / 64.8°F) | 28.7 / 21.0°C (83.6 / 69.8°F) | 28.1 / 22.8°C (82.6 / 73.1°F) |
| May | 29.5 / 19.4°C (85.1 / 66.9°F) | 29.9 / 17.7°C (85.9 / 63.9°F) | 31.3 / 19.1°C (88.4 / 66.3°F) | 31.3 / 21.4°C (88.3 / 70.6°F) | 30.4 / 23.0°C (86.7 / 73.4°F) | 29.9 / 24.7°C (85.9 / 76.4°F) |
| Jun | 32.2 / 23.1°C (90.0 / 73.5°F) | 32.2 / 21.5°C (89.9 / 70.7°F) | 32.7 / 22.0°C (90.8 / 71.6°F) | 32.5 / 24.1°C (90.5 / 75.4°F) | 31.8 / 24.6°C (89.3 / 76.3°F) | 31.5 / 26.3°C (88.7 / 79.4°F) |
| Jul | 33.1 / 24.1°C (91.6 / 75.3°F) | 33.3 / 22.9°C (91.9 / 73.2°F) | 33.3 / 22.9°C (92.0 / 73.2°F) | 32.8 / 24.8°C (91.0 / 76.6°F) | 32.6 / 25.3°C (90.6 / 77.5°F) | 32.3 / 27.0°C (90.2 / 80.6°F) |
| Aug | 32.8 / 23.9°C (91.0 / 75.0°F) | 32.7 / 23.0°C (90.8 / 73.4°F) | 33.1 / 23.2°C (91.6 / 73.7°F) | 32.9 / 24.9°C (91.2 / 76.8°F) | 32.6 / 25.4°C (90.7 / 77.7°F) | 32.6 / 26.9°C (90.6 / 80.5°F) |
| Sep | 31.4 / 21.9°C (88.5 / 71.5°F) | 30.7 / 21.4°C (87.2 / 70.5°F) | 32.0 / 22.4°C (89.6 / 72.4°F) | 32.3 / 24.1°C (90.2 / 75.3°F) | 31.7 / 24.9°C (89.0 / 76.9°F) | 31.7 / 26.2°C (89.0 / 79.2°F) |
| Oct | 27.3 / 16.4°C (81.1 / 61.6°F) | 27.2 / 16.4°C (80.9 / 61.5°F) | 29.3 / 19.0°C (84.7 / 66.2°F) | 29.8 / 20.7°C (85.6 / 69.2°F) | 29.9 / 23.4°C (85.9 / 74.2°F) | 29.9 / 24.9°C (85.8 / 76.8°F) |
| Nov | 22.1 / 10.6°C (71.8 / 51.0°F) | 22.9 / 10.7°C (73.2 / 51.3°F) | 25.7 / 14.6°C (78.3 / 58.2°F) | 26.1 / 15.9°C (78.9 / 60.7°F) | 27.4 / 20.2°C (81.3 / 68.3°F) | 27.2 / 22.3°C (81.0 / 72.2°F) |
| Dec | 18.4 / 7.7°C (65.1 / 45.9°F) | 19.7 / 7.7°C (67.5 / 45.8°F) | 23.2 / 11.6°C (73.8 / 52.9°F) | 23.3 / 13.3°C (73.9 / 55.9°F) | 25.7 / 17.9°C (78.2 / 64.3°F) | 25.4 / 20.2°C (77.7 / 68.3°F) |
Station identities: Pensacola Regional Airport, USW00013899; Jacksonville, USW00013889; Orlando International Airport, USW00012815; Tampa International Airport, USW00012842; Miami International Airport, USW00012839; Key West International Airport, USW00012836. These are station observations. An airport is not every beach, neighbourhood or inland park around it; coastal wind and local exposure can feel different. For detailed city planning, use the existing Miami weather guide.
What coastal and inland stations can tell you
Rainfall does not follow one identical statewide calendar. Orlando and Tampa have a marked summer increase; Miami retains a substantial October normal, while the northern stations show their own pattern. Key West's September normal is considerably wetter than its winter and early spring months. Compare the actual stops on your route rather than applying Orlando's numbers to the entire coastline.
Swipe or scroll horizontally to compare all columns.
| Month | Pensacola | Jacksonville | Orlando | Tampa | Miami | Key West |
|---|---|---|---|---|---|---|
| Jan | 128 mm (5.03 in) | 83 mm (3.28 in) | 63 mm (2.48 in) | 67 mm (2.65 in) | 46 mm (1.83 in) | 46 mm (1.83 in) |
| Feb | 121 mm (4.77 in) | 73 mm (2.86 in) | 52 mm (2.04 in) | 67 mm (2.62 in) | 55 mm (2.15 in) | 39 mm (1.54 in) |
| Mar | 133 mm (5.25 in) | 84 mm (3.29 in) | 77 mm (3.03 in) | 64 mm (2.52 in) | 62 mm (2.46 in) | 39 mm (1.53 in) |
| Apr | 140 mm (5.52 in) | 74 mm (2.93 in) | 66 mm (2.58 in) | 65 mm (2.55 in) | 85 mm (3.36 in) | 53 mm (2.07 in) |
| May | 99 mm (3.90 in) | 87 mm (3.42 in) | 102 mm (4.02 in) | 66 mm (2.60 in) | 161 mm (6.32 in) | 79 mm (3.12 in) |
| Jun | 186 mm (7.32 in) | 193 mm (7.60 in) | 204 mm (8.05 in) | 187 mm (7.37 in) | 267 mm (10.51 in) | 107 mm (4.23 in) |
| Jul | 200 mm (7.89 in) | 172 mm (6.77 in) | 189 mm (7.46 in) | 197 mm (7.75 in) | 187 mm (7.36 in) | 92 mm (3.63 in) |
| Aug | 191 mm (7.50 in) | 175 mm (6.88 in) | 195 mm (7.69 in) | 229 mm (9.03 in) | 243 mm (9.58 in) | 136 mm (5.37 in) |
| Sep | 168 mm (6.61 in) | 192 mm (7.56 in) | 162 mm (6.37 in) | 155 mm (6.09 in) | 260 mm (10.22 in) | 184 mm (7.24 in) |
| Oct | 119 mm (4.70 in) | 102 mm (4.03 in) | 88 mm (3.46 in) | 59 mm (2.34 in) | 194 mm (7.65 in) | 144 mm (5.67 in) |
| Nov | 112 mm (4.42 in) | 51 mm (2.00 in) | 45 mm (1.79 in) | 36 mm (1.40 in) | 90 mm (3.53 in) | 52 mm (2.05 in) |
| Dec | 137 mm (5.40 in) | 71 mm (2.78 in) | 63 mm (2.48 in) | 65 mm (2.56 in) | 62 mm (2.44 in) | 55 mm (2.16 in) |
A monthly total cannot tell you how many hours of a particular day will be dry. It can include intense downpours, several wet spells or an unusually wet event within the historical period. Neither table contains sea temperature, humidity, surf conditions or a current tropical-weather forecast.
Winter and spring: compare the north with the south
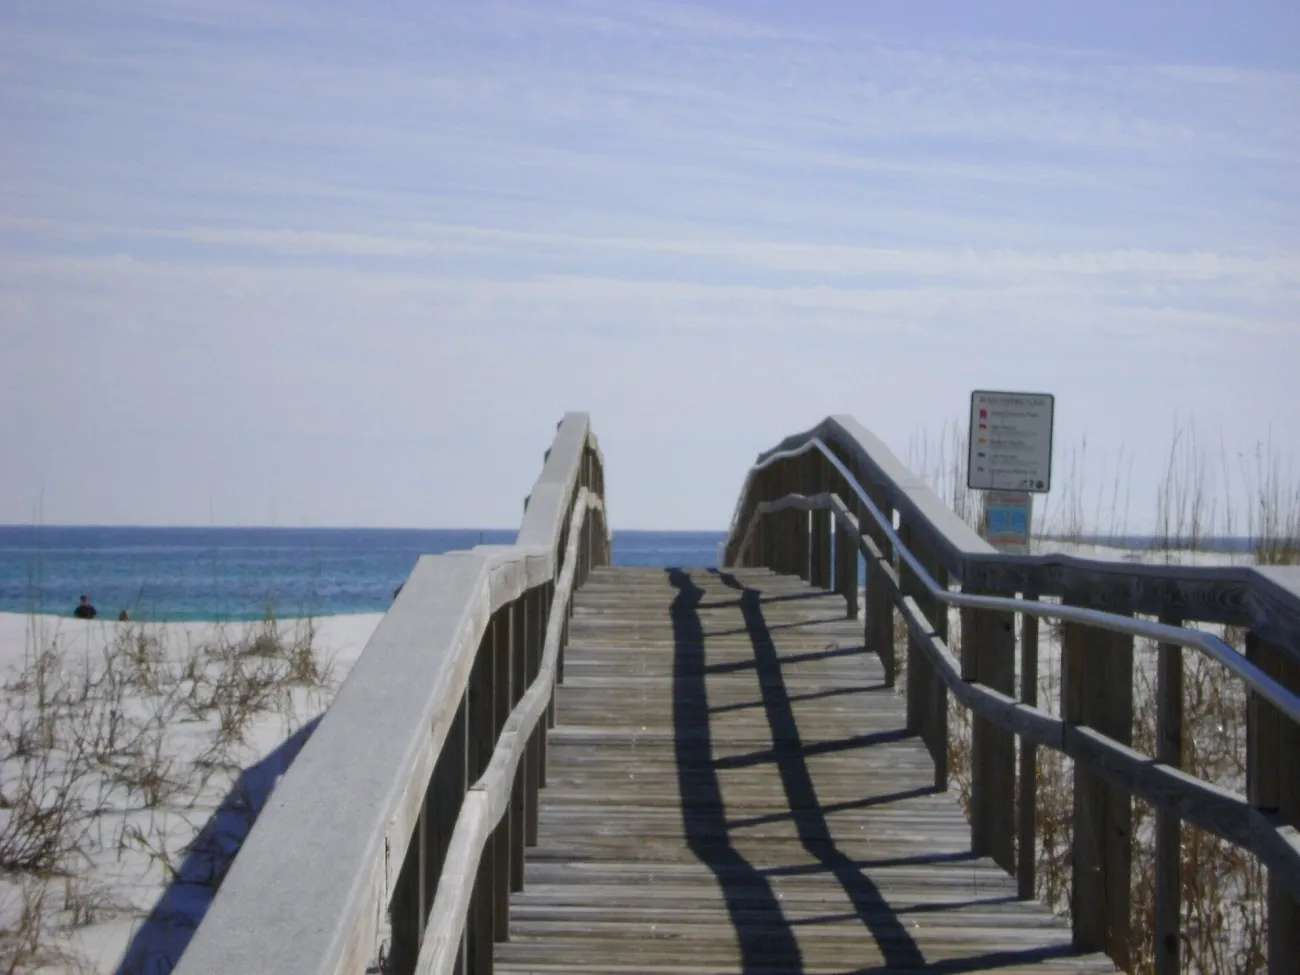
December to February: the Panhandle, Miami and the Keys
Winter is a good reason to distinguish a beach walk from a beach-swimming holiday. Pensacola's January daytime normal is 17.1°C/62.7°F; Key West's is 24.3°C/75.8°F. Both are coastal Florida, yet the same suitcase and daily plan will not suit them equally well. Pack a warm layer for northern evenings and early starts, and retain a wind-resistant layer for exposed waterfronts farther south.
For South Florida, pair outdoor sightseeing with a flexible water day rather than making every day depend on swimming or a boat. For the Everglades, the National Park Service describes December–April as the usual dry season. That supports choosing the period for a walking-focused visit, but it also brings the park's busiest conditions. The Everglades guide explains entrances and visit lengths.
March to May: holidays, crowds and changing conditions
Spring offers a useful compromise for a route with several kinds of day. Orlando's normal high rises from 26.1°C/78.9°F in March to 31.3°C/88.4°F in May, so “spring” is not one fixed level of warmth. A later date can feel quite different in a park queue or on a long walk.
School breaks, Easter and event weekends vary by year. Check the dates you can actually travel before assuming a shoulder-season price. If your itinerary has both a timed attraction and a beach stay, secure the constrained visit first, then use the flexible days around it.
Summer and early autumn: plan around heat and rain
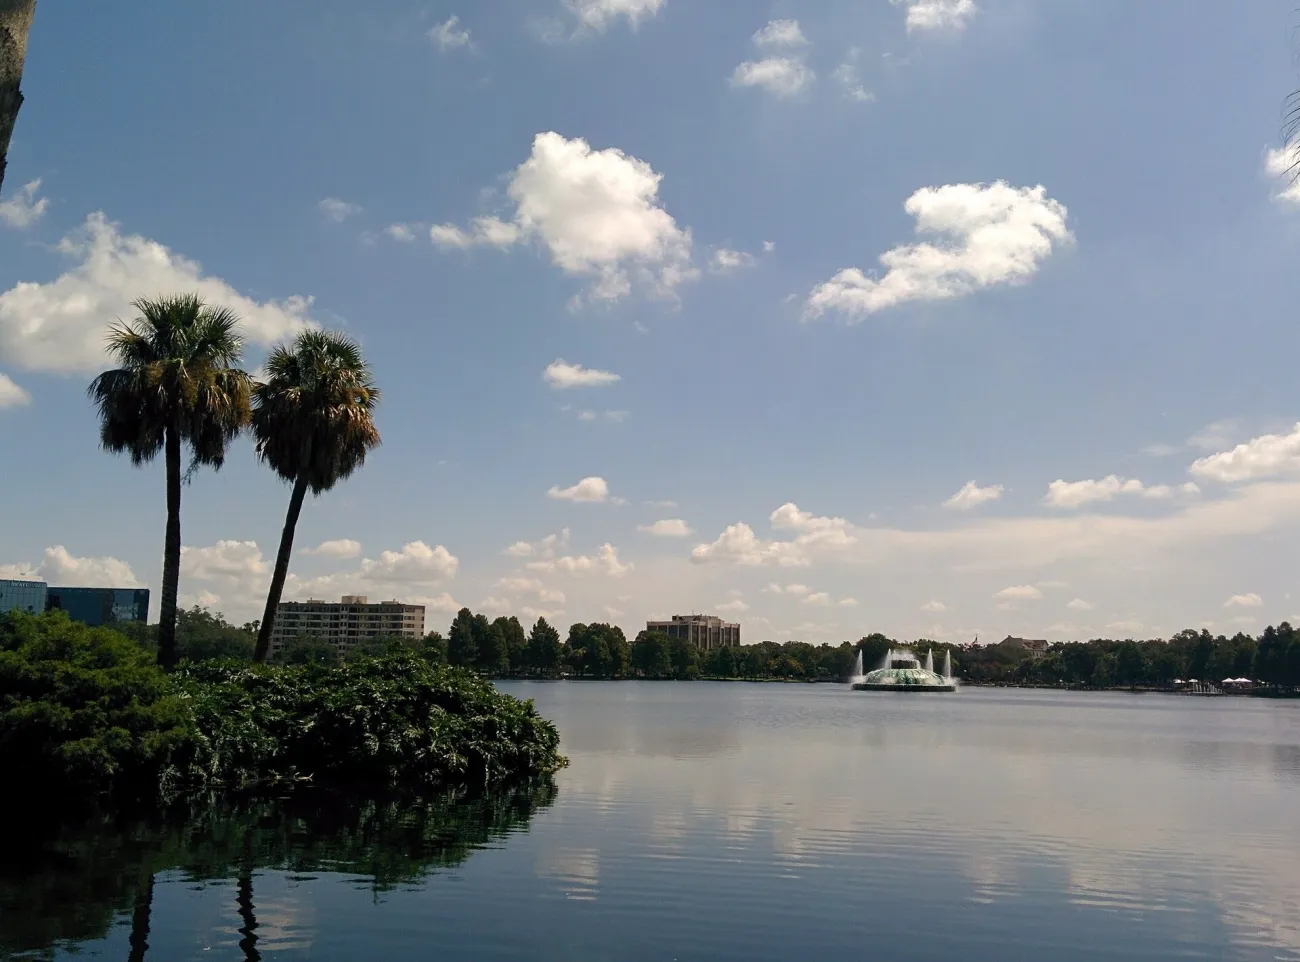
June to September: allow flexible outdoor time
Summer is workable for visitors whose dates are fixed, provided the itinerary is not built as a succession of long exposed afternoons. Separate an outdoor visit from a second major commitment, identify an indoor break and carry the essentials for sudden rain. A waterproof bag is more useful than a plan that assumes every shower will pass before your reservation.
Do not treat a swimming pool as a weather-independent alternative: lightning can affect pools and beaches as well as rides. Follow the venue's instructions when operations pause. The Florida theme park comparison covers park choices and tickets; the safety guide covers heat and lightning actions.
October and November: do not assume the wet season ends everywhere at once
October can be a useful travel month, but Miami's rainfall normal is 7.65 inches, compared with Tampa's 2.34 inches. A general statement that Florida is dry in autumn hides that difference. November's normals are lower at both stations, although the official Atlantic hurricane season still extends through the month.
For a multi-base holiday, let the actual forecast guide which day carries a boat trip, beach outing or long outdoor walk. Retain an indoor city activity or unhurried meal near the same base; changing to a distant region at short notice can cost more usable time than the weather change saves.
Hurricane season and booking decisions
What the official season dates tell you
The National Hurricane Center defines the Atlantic hurricane season as 1 June–30 November. Its basin-wide climatology places the main concentration of activity from mid-August to mid-October, but storms can occur outside the official dates. Those facts describe a season and a basin; they are not the probability that your hotel will be affected on a particular week.
Our month-by-month hurricane-season article examines historical patterns separately. Use it as background, then use current official forecasts and local instructions for a real trip. A hurricane track on a map does not replace a notice from the county where you are staying.
Swipe or scroll horizontally to compare all columns.
| Information | Useful for | It cannot establish | Where to go next |
|---|---|---|---|
| Monthly climate normals | Choosing a region and season | Your travel week's actual weather | The six-station comparison above |
| Historical storm analysis | Understanding past patterns | The probability of disruption to your booking | Our hurricane-season article |
| Current NHC / NWS information | Following a developing system or local forecast | Your hotel's operating decision or all local orders | The live official forecast and warnings |
| County instructions / operator notice | Responding to local conditions and service decisions | The terms of a different booking | The county or provider responsible for your actual location |
What to check before a non-refundable booking
Read the actual cancellation and change conditions for each room, ticket, tour and transport booking. Confirm whether a disruption to one part of the journey leaves the others usable. An airline change does not automatically describe what an independently booked hotel will do, and a weather cancellation does not establish a particular insurance entitlement. Keep the relevant terms with your booking details.
Match the season to beaches, parks and boat trips
Gulf Coast and Atlantic beaches
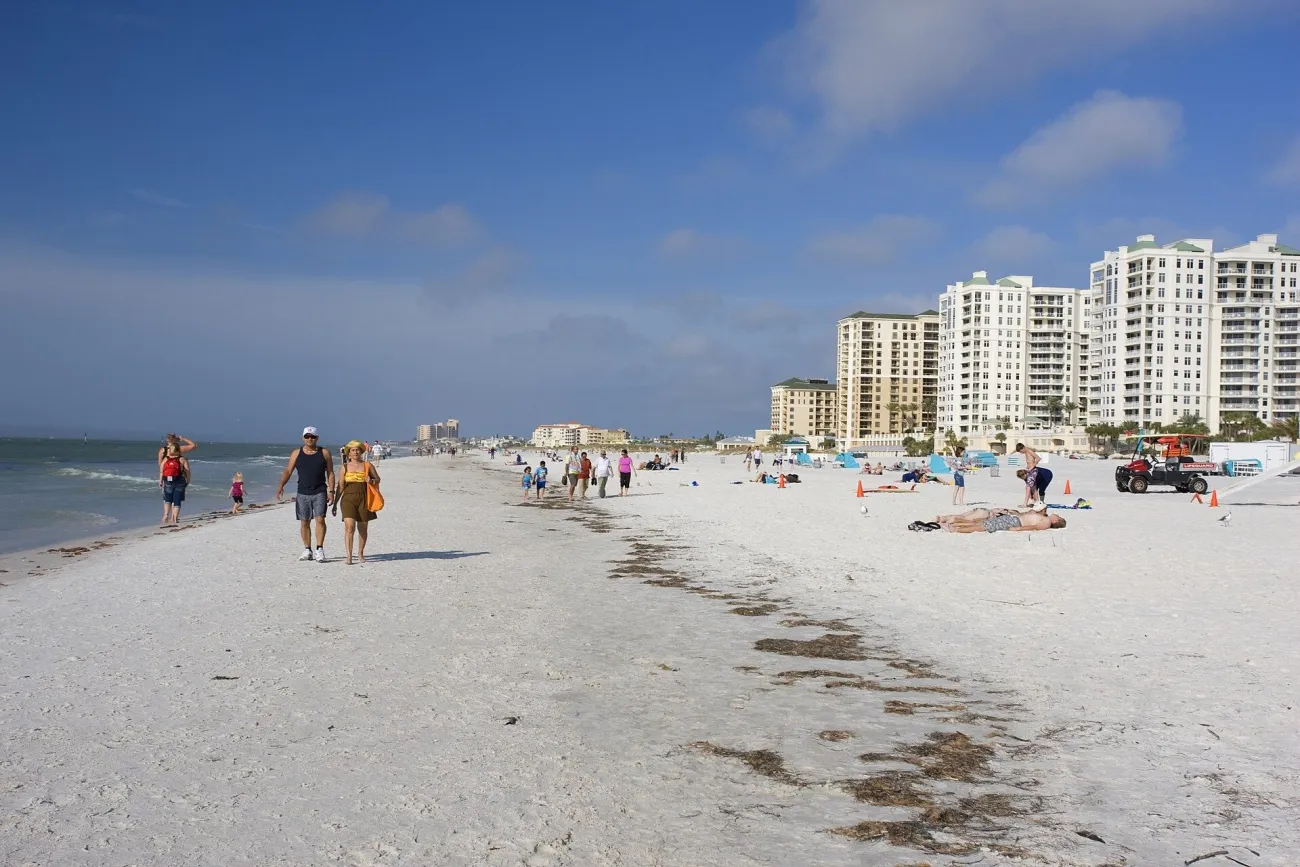
Choose your coastline with the Florida beach guide, then make the swimming decision locally. Sunny skies and a calm-looking surface do not establish safe water. Check the beach forecast, lifeguard advice, flags and current water-quality notices for the actual access point. Rainfall normals have no authority over those conditions.
The Everglades and the Florida Keys
A dry-season Everglades visit and a Keys boat trip solve different planning problems. The first involves park access, walking conditions and available programmes; the second also depends on wind, sea state and the operator's departure decision. Stay on the island that fits your main activities, using the Florida Keys guide, instead of assuming every launch point is interchangeable.
Swipe or scroll horizontally to compare all columns.
| Plan | Seasonal context | Check near the visit | Detailed planning |
|---|---|---|---|
| A beach day | Regional air-temperature and rainfall normals | Surf forecast, lifeguards/flags and water-quality advisories | Beaches and Safety |
| A theme park day | Heat and rainfall pattern for the region | Actual park calendar, forecast and weather pauses | Theme Parks |
| An Everglades visit | Park's usual wet/dry seasons | Entrance/trail conditions and available programmes | Everglades |
| A Keys boat trip | Seasonal context at the relevant island | Wind/sea conditions and the operator's departure decision | Florida Keys |
Use the forecast close to departure
What to pack for your region and month
For a route spanning northern and southern Florida, bring layers rather than duplicating a summer wardrobe. Light rain protection, comfortable walking footwear and a way to keep documents and electronics dry cover several types of day. Check your particular accommodation and activities before filling a suitcase with bulky beach equipment that may already be available.
Build one practical weather alternative
Choose a fallback in the same area: a museum instead of an exposed walk, a city meal instead of a coastal excursion, or a rest period before an evening event. Verify opening hours and tickets rather than relying on the word “indoor”. In the final days before departure, consult the National Weather Service for each overnight base and check any park or tour notice again.
Sources and Planning Checks
Climate comparisons use NOAA/NCEI station normals for 1991–2020, checked on 11 November 2026. Seasonal Everglades context comes from the National Park Service; hurricane-season dates come from the National Hurricane Center. The tables describe historical averages. Live forecasts, venue schedules, marine conditions and warnings need a separate check for your travel dates.
Florida Weather and Seasons FAQ
What is the best month to visit Florida for a first trip?
Start by comparing March–April and November if you want a mix of sightseeing and outdoor days. Your route and available dates matter more than a single statewide winner. For a Panhandle swimming trip or a park-heavy summer holiday, use the regional tables and adjust the plan accordingly.
Is winter warm enough for a Florida beach holiday?
South Florida and the Keys have much warmer winter air normals than the Panhandle, but air temperature does not guarantee comfortable swimming water or calm seas. Decide whether your holiday needs daily swimming or would still work with waterfront walks, sightseeing and occasional water activities.
Does summer rain usually rule out a day at a theme park?
A high monthly rainfall total does not mean uninterrupted rain all day. It does make flexibility useful. Plan indoor breaks, allow operational pauses and follow the park's weather instructions; do not build the day around a guarantee that rain arrives or finishes at a particular hour.
When is hurricane season in Florida?
The official Atlantic season is 1 June–30 November. The season describes a broad period of activity, not a forecast for your booking. Check current NHC/NWS information and the instructions of the local county if a tropical system could affect your route.
Do the Panhandle and the Florida Keys have the same seasons?
No. Both have hot summer conditions, but their winter temperatures and rainfall patterns differ substantially. January's normal overnight low is about 6.5°C/43.7°F at Pensacola and 18.6°C/65.5°F at Key West. Use the station nearest your actual route as a starting point, with local forecasts for the visit itself.